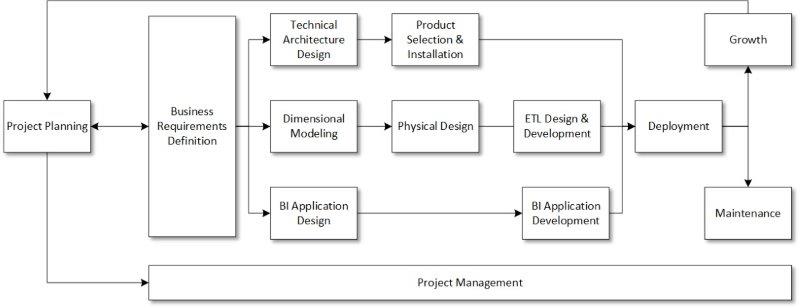
Nowadays, Enterprises are seeking to leverage each market’s data to be more insight driven in its operations. They intend to achieve this by implementing a consolidated data lake to centralize the information from core systems (ERP, DMS, CRM and excel; extending to market data, demographic data, marketing analytics, social media, mobile apps and others in the future) and integrating visualization capability longer term there is a vision to extend this into predictive analytics and automation (BI). The true power of a business intelligence system which relies upon a data warehouse comes from using conformed data dimensions to help analyze and drive business decisions. For example, one system may refer to a customer as someone who has purchased goods within the past twelve months. Another system may define a customer as any company who has ever been in contact about services. By understanding the needs and importance of data analysis, We have built a Data Warehouse based on MS Azure Data Warehouse. It is a modern data warehouse lets you bring together all your data at any scale easily, and to get insights through analytical dashboards, operational reports, or advanced analytics for all your users. 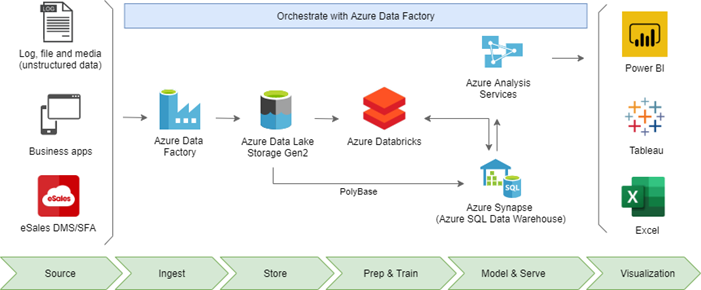 The following is our approach how to organize a successful implementation of a DW/BI project. Key factors to implement a data warehouse project success: Focus on the business’s needs, present dimensionally structured data to users, and tackle manageable, iterative projects. In the below diagram we propose a best practice lifecycle roadmap for a DW/BI project, all these factors are reflected in this diagram.

Query and Analyze Data More Efficiently
It is simpler to query and analyze data in a structured data warehouse because of its clearly defined organization. The amount of data that needs to be collected, stored, and analyzed has increased substantially

Provide accurate and complete information
Data warehouses are regularly updated and contain data from numerous sources, assisting in giving users accurate and comprehensive information

Save time and human resources
All data is stored, eliminating the need to look through and query data from many sources

Make easily executive decisions
Facilitated by data analysis from data warehouses, which enables firms to make better operational decisions based on accurate and comprehensive data

Support for measuring and evaluating business performance
Data warehouses offer historical and current data on sales, company performance, and many other variables. Assist consumers in taking quick, logical decisions that are more effective; gain more money...

Productivity and work efficiency
Are increased by using a data warehouse, which also improves the business's utilization of data through data processing and analysis
INDUSTRIES

FMCG

Pharmaceutical

F&B

Agriculture

Lubricant

Construction
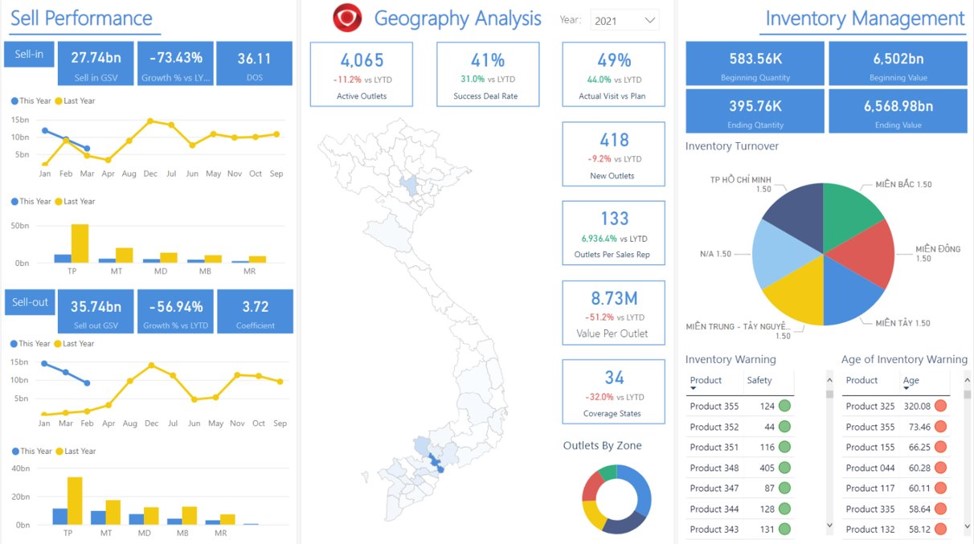
SAMPLE OF BI DASHBOARD
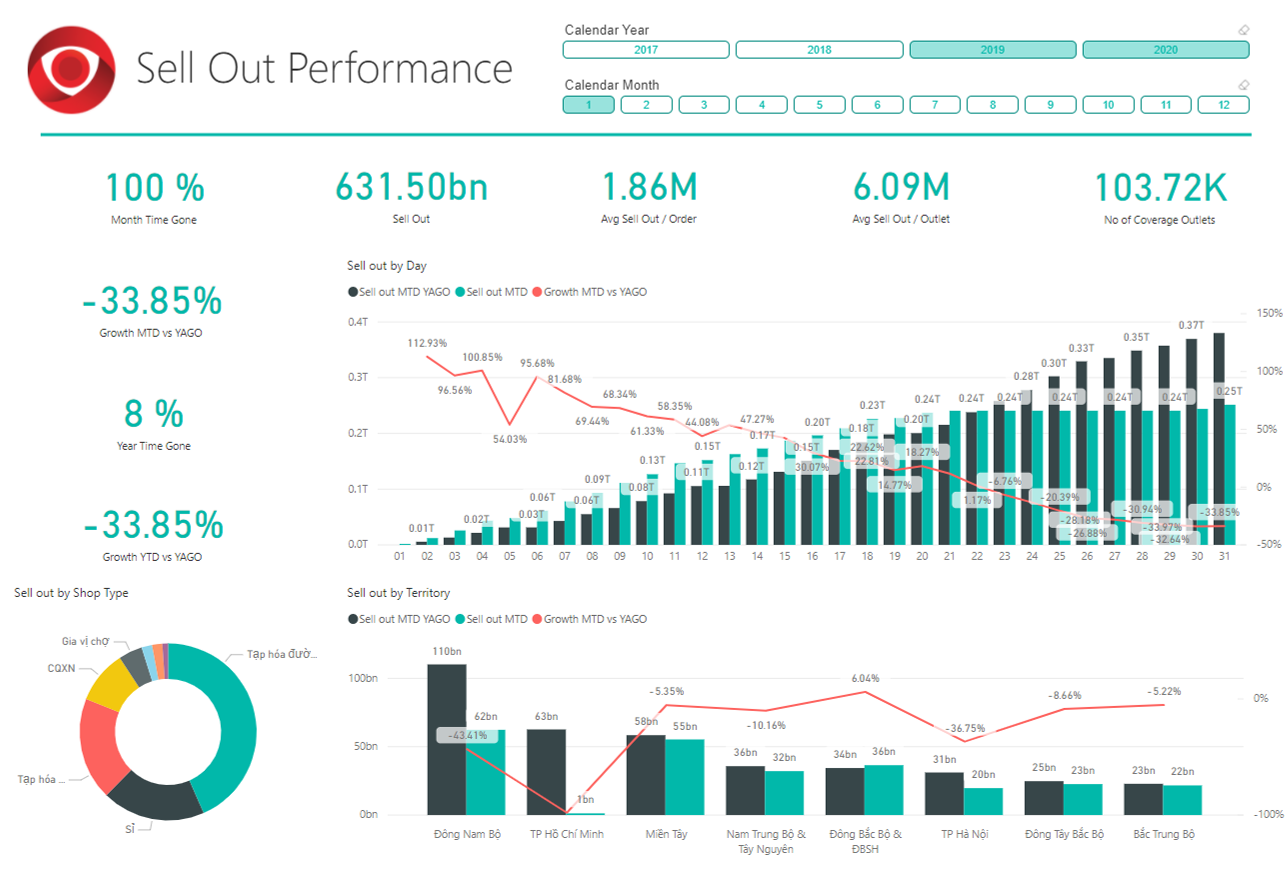
Sell-out Analytic Dashboard
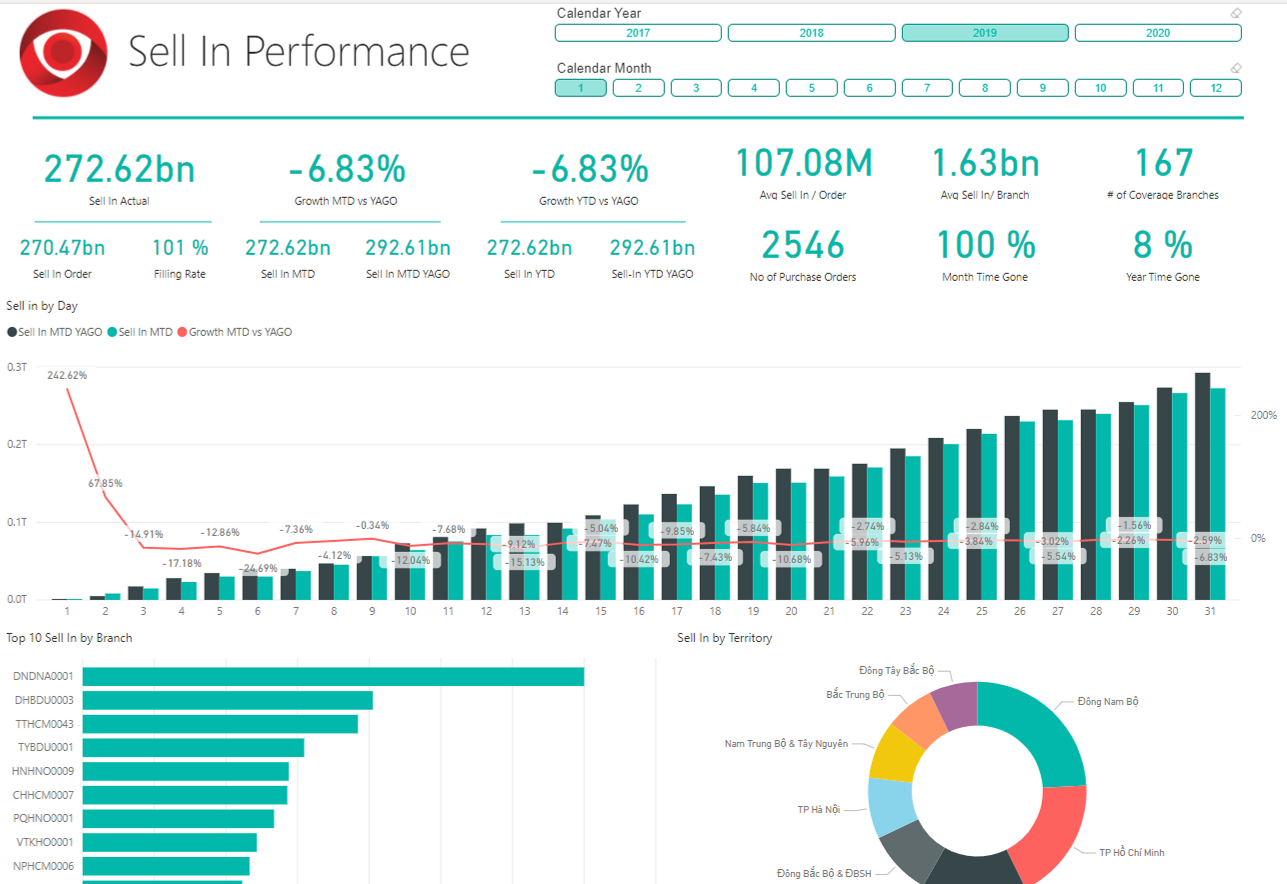
Sell-in Analytic Dashboard
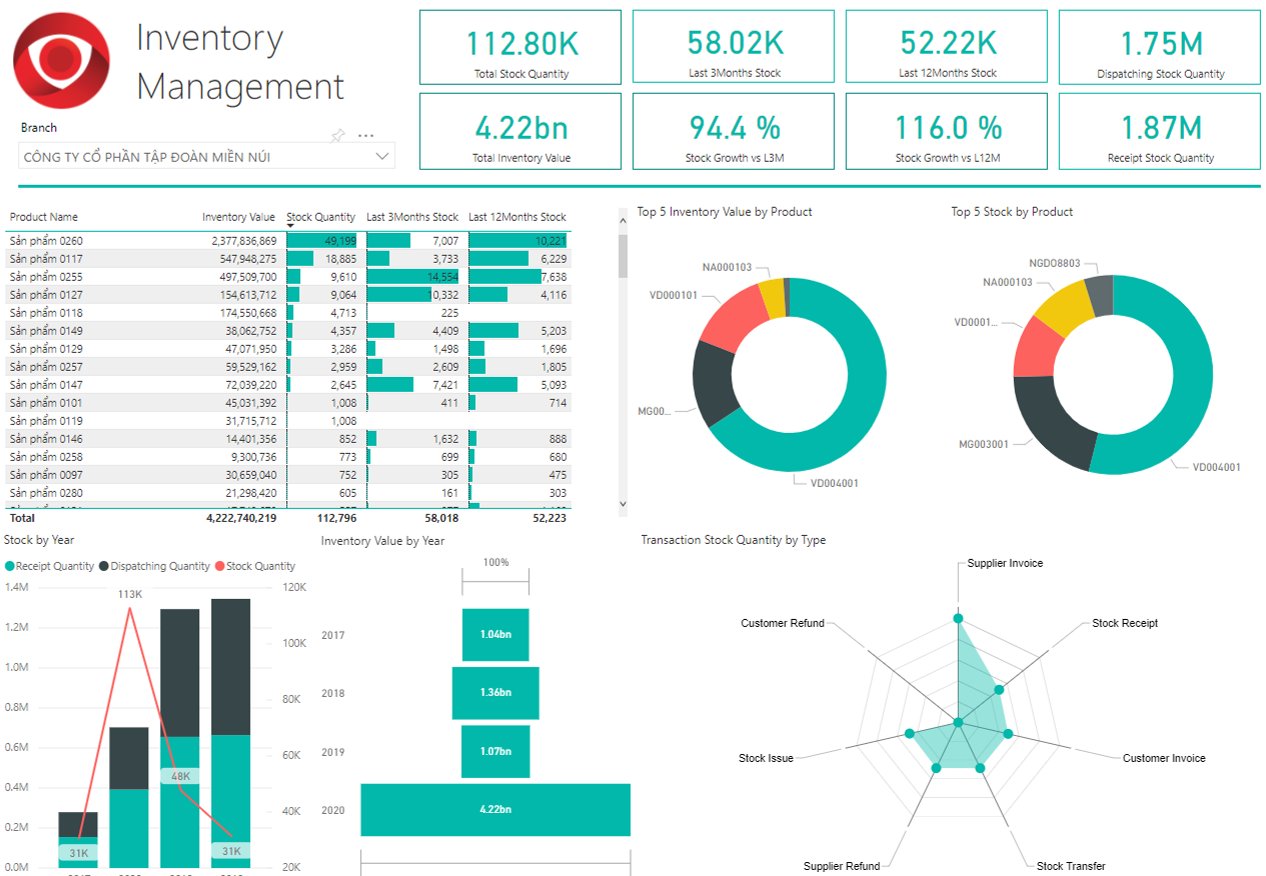
Inventory Analytic Dashboard